Monitor VMWare Datastores with Esxtop
Monitor Storage Paths with vCenter
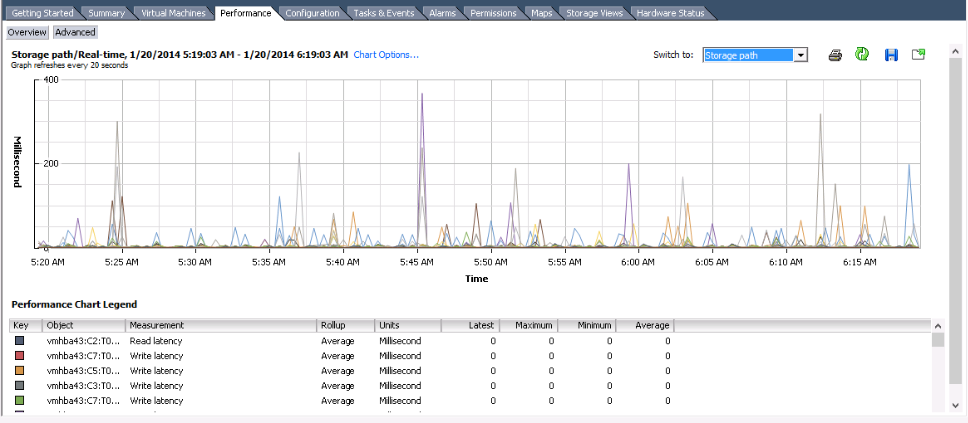
Typically, I monitor my VMWare hosts’ storage paths with vcenter by clicking on the physical host and then going to performance and choosing storage path in the drop down.
But on this time, vCenter was all but non-responsive and the performance charts were one of the victims of the poor performance. Luckily, it was the middle of the night and the virtual machines poor performance would not be an issue for several hours so I had some time to explore.
ESXTOP for Detailed VMWare Performance Monitoring
I was able to ssh into the affected VMWare physical host and from there begin to run esxtop to look at the performance. When one starts up esxtop, they get the default screen which shows the currently running processes on the VMWare host.
7:38:02pm up 2 days 20:31, 453 worlds, 11 VMs, 19 vCPUs; CPU load average: 0.03, 0.03, 0.04
PCPU USED(%): 2.5 1.9 1.8 1.5 0.3 0.2 7.9 2.4 3.1 3.2 35 4.0 3.1 3.4 4.2 7.5 9.5 0.7 0.2 0.3 0.0 0.4 1.1 3.3 3.7 0.8 0.9 1.2 0.4 2.7 0.3 0.4 AVG: 3.4
PCPU UTIL(%): 3.2 2.4 2.2 2.2 0.3 0.4 8.3 2.9 4.4 4.3 36 5.4 4.3 4.6 5.2 8.4 9.7 0.6 0.1 0.5 0.2 0.6 1.2 4.0 3.9 0.8 1.1 1.1 0.3 3.6 0.4 0.6 AVG: 3.9
ID GID NAME NWLD %USED %RUN %SYS %WAIT %VMWAIT %RDY %ID
1 1 idle 32 3053.55 3200.00 0.01 0.00 - 3200.00 0.
16254 16254 server1.uptime 14 116.13 114.67 2.92 1286.85 2.21 0.16 684.
7544 7544 server2.uptimim 8 5.55 5.40 0.16 795.54 0.20 0.01 94.
15843 15843 mongo.uptimemad 9 5.27 4.91 0.32 896.16 0.76 0.01 194.
415224 415224 esxtop.241148 1 4.08 4.07 0.00 96.01 - 0.00 0.
32835 32835 server3.uptimem 7 2.70 2.58 0.12 697.98 0.18 0.01 97.
15366 15366 server4.uptimem 7 2.64 2.48 0.14 698.33 0.20 0.01 97.
31937 31937 server5.uptimem 7 1.55 1.55 0.01 699.27 0.00 0.02 98.
8226 8226 server6.uptimemad 7 1.02 0.99 0.02 699.54 0.00 0.02 100.
7859 7859 Varnish.uptimemad 7 0.93 0.91 0.02 699.91 0.11 0.02 99.
7221 7221 server7.uptimemad 7 0.75 0.62 0.13 700.00 0.00 0.07 99.
8575 8575 server8.uptimemad 7 0.64 0.63 0.00 699.88 0.00 0.04 100.
32484 32484 server9.uptimem 7 0.59 0.58 0.01 700.00 0.40 0.03 99.
From this screen, we can change the display to monitoring other performance behavior. By hitting the “?” key, we get the other performance options:
Esxtop: top for ESX

These single-character commands are available:

^L      - redraw screen
space   - update display
h or ?  - help; show this text
q       - quit

Interactive commands are:

fF	Add or remove fields
oO	Change the order of displayed fields
s	Set the delay in seconds between updates
#	Set the number of instances to display
W	Write configuration file ~/.esxtop50rc
k	Kill a world
e	Expand/Rollup Cpu Statistics
V	View only VM instances
L	Change the length of the NAME field
l	Limit display to a single group

Sort by:
	U:%USED 	R:%RDY 		N:GID
Switch display:
	c:cpu    	i:interrupt	m:memory	n:network
	d:disk adapter	u:disk device	v:disk VM	p:power mgmt

Hit any key to continue:
You can see that there are tons of options for monitoring. Since my problem was related to the disk device access, as I used esxtop, most of my time was spend using “d” – disk adapter and “u” – disk device.
In this example, let’s hit the <spacebar> to continue, then hit the “u” key to get to the disk device view. This takes us to this disk device screen:
 8:32:41pm up 2 days 21:26, 450 worlds, 11 VMs, 19 vCPUs; CPU load average: 0.03, 0.04, 0.03

DEVICE                                PATH/WORLD/PARTITION DQLEN WQLEN ACTV QUED %USD  LOAD
mpx.vmhba0:C0:T0:L0                            -               1     -    0    0    0  0.00
naa.6782bcb0000e972100000af24f9535a4           -              32     -    0    0    0  0.00
naa.6782bcb0000e972100000af54f9535b9           -             128     -    0    0    0  0.00
naa.6782bcb0000e972100000bcc502dfee9           -             128     -    0    0    0  0.00
naa.6782bcb0003c4480000011f251847d5f           -             128     -    0    0    0  0.00
naa.6782bcb0003c4480000086fd52d5d3a8           -             128     -    0    0    0  0.00
naa.6782bcb000447e6e000006873d9d8a9c           -             128     -    0    0    0  0.00
naa.6782bcb000448a4700000bb050570aad           -             128     -    0    0    0  0.00
naa.6782bcb000448a47000013155183a505           -             128     -    0    0    0  0.00
naa.6782bcb000448a47000086e752d4fb9d           -             128     -    0    0    0  0.00
naa.6d4ae520a770fa0017b6ce4d0b83970d           -             128     -    0    0    0  0.00
t10.DP______BACKPLANE000000                    -             128     -    0    0    0  0.00
Now, at this point, we want to modify the columns that are displayed so that we can get the ones that are most important to watching our disk latency. To modify the “Fields” in the list, hit the “f” key which will bring you to the Field Screen:
Current Field order: ABcdeFGhIjklmnop

* A:  DEVICE = Device Name
* B:  ID = Path/World/Partition Id
  C:  NUM = Num of Objects
  D:  SHARES = Shares
  E:  BLKSZ = Block Size (bytes)
* F:  QSTATS = Queue Stats
* G:  IOSTATS = I/O Stats
  H:  RESVSTATS = Reserve Stats
* I:  LATSTATS/cmd = Overall Latency Stats (ms)
  J:  LATSTATS/rd = Read Latency Stats (ms)
  K:  LATSTATS/wr = Write Latency Stats (ms)
  L:  ERRSTATS/s = Error Stats
  M:  PAESTATS/s = PAE Stats
  N:  SPLTSTATS/s = SPLIT Stats
  O:  VAAISTATS= VAAI Stats
  P:  VAAILATSTATS/cmd = VAAI Latency Stats (ms)

Toggle fields with a-p, any other key to return:
So, I was and actually still am mostly interested in the “I: LATSTATS/cmd = Overall Latency Stats (ms)” data, so I need to eliminate some fields prior so that the latency data will appear. By typing “f” and then “g”, we can toggle off the QSTATS and IOSTATS, and then hit the spacebar to return to the disk device view.
This brings us back to the disk device view:
 8:39:03pm up 2 days 21:32, 451 worlds, 11 VMs, 19 vCPUs; CPU load average: 0.02, 0.03, 0.03

DEVICE                                PATH/WORLD/PARTITION DAVG/cmd KAVG/cmd GAVG/cmd QAVG/cm
mpx.vmhba0:C0:T0:L0                            -               0.00     0.00     0.00     0.0
naa.6782bcb0000e972100000af24f9535a4           -               0.82     0.02     0.84     0.0
naa.6782bcb0000e972100000af54f9535b9           -               3.01     0.01     3.01     0.0
naa.6782bcb0000e972100000bcc502dfee9           -               0.73     0.01     0.74     0.0
naa.6782bcb0003c4480000011f251847d5f           -               0.64     0.01     0.66     0.0
naa.6782bcb0003c4480000086fd52d5d3a8           -               0.90     0.01     0.91     0.0
naa.6782bcb000447e6e000006873d9d8a9c           -             104.40     0.01   104.41     0.0
naa.6782bcb000448a4700000bb050570aad           -             109.66     0.02   109.68     0.0
naa.6782bcb000448a47000013155183a505           -               1.09     0.01     1.10     0.0
naa.6782bcb000448a47000086e752d4fb9d           -               1.01     0.01     1.02     0.0
naa.6d4ae520a770fa0017b6ce4d0b83970d           -               0.07     0.01     0.08     0.0
t10.DP______BACKPLANE000000                    -               0.00     0.00     0.00     0.0
So, the important columns for your attention are of course:
- DEVICE – This is the actual disk device whether it is local disk, iSCSI, etc… See below to map your LUN IDs to the actual datastore names.
- DAVG/cmd – This is the average latency in milliseconds with this device
- KAVG/cmd – This is the average latency in milliseconds that commands are spending in the kernel
- GAVG/cmd – This is the latency in milliseconds as experienced by the guest operating system. This is DAVG + KAVG.
By the way, you can get more details on using the esxtop esxcli command at http://www.yellow-bricks.com/esxtop/. Mr. Duncan Epping has created an excellent documentation page on esxtop as well as other things.
Typically, we are hoping for the DAVG/cmd column to be under 20 milliseconds. In the example above, you can see that I caught this system with a couple of devices over 100 milliseconds which isn’t particularly good. During this event, my esxi host was experiencing latency in the thousands. Typically, these are quick blips that return back down to near zero. If you are seeing it continually high for a device, you may wish to review which VMs are running on that device and what is running in those VMs and perhaps move some things around.
Map VMWare esxi LUN IDs to Datastore Names
So, now that you know that some of your datastores have excessive latency and you want to investigate things a bit, you need to know the actual datastore names. You can map your esxi LUN IDs to Datastore Names using the esxcli command: esxcfg-scsidevs.
/vmfs # esxcfg-scsidevs --vmfs
naa.6782bcb000447e6e000006873d9d8a9c:1                           /vmfs/devices/disks/naa.6782bcb000447e6e000006873d9d8a9c:1 4f3bdd4c-33b6b171-2be9-d067e5f92eff  0  iSCSI-AppServer1
naa.6782bcb0000e972100000af24f9535a4:1                           /vmfs/devices/disks/naa.6782bcb0000e972100000af24f9535a4:1 4f959aaa-8e643044-9748-d067e5f92eff  0  iSCSI-AppServer3
naa.6782bcb0000e972100000bcc502dfee9:1                           /vmfs/devices/disks/naa.6782bcb0000e972100000bcc502dfee9:1 502e65f0-ae129e80-a678-d067e5f92eff  0  iSCSI-AppServer5
naa.6782bcb000448a47000013155183a505:1                           /vmfs/devices/disks/naa.6782bcb000448a47000013155183a505:1 51841881-0530fab7-aa55-d067e5f92efb  0  iSCSI-AppServer8
naa.6782bcb000448a47000086e752d4fb9d:1                           /vmfs/devices/disks/naa.6782bcb000448a47000086e752d4fb9d:1 52d572b7-1f8626a8-6603-d067e5f92efb  0  iSCSI-AppServer9
naa.6782bcb0003c4480000086fd52d5d3a8:1                           /vmfs/devices/disks/naa.6782bcb0003c4480000086fd52d5d3a8:1 52d572df-6e9c3eb1-d035-d067e5f92efb  0  iSCSI-AppServer10
naa.6d4ae520a770fa0017b6ce4d0b83970d:3                           /vmfs/devices/disks/naa.6d4ae520a770fa0017b6ce4d0b83970d:3 502bd652-e1748d1d-5912-d4ae52e61ce6  0  datastore1 (1)
naa.6782bcb0003c4480000011f251847d5f:1                           /vmfs/devices/disks/naa.6782bcb0003c4480000011f251847d5f:1 51841845-24b18ec9-9707-d067e5f92efb  0  iSCSI-AppServer7
naa.6782bcb000448a4700000bb050570aad:1                           /vmfs/devices/disks/naa.6782bcb000448a4700000bb050570aad:1 50577d0c-cc34c946-4a07-d067e5f92efb  0  iSCSI-AppServer6
naa.6782bcb0000e972100000af54f9535b9:1                           /vmfs/devices/disks/naa.6782bcb0000e972100000af54f9535b9:1 4f959adc-fc607199-352a-d067e5f92eff  0  iSCSI-AppServer4
Follow